Percent of Change Scavenger Hunt Activity {Free Download}

This week in Algebra 1 we covered the topic of percent of change, which is one of the many Algebra 1 topics that is covered in middle school but gets revisited in high school.  The concept of percent of change isn’t too challenging, even when working backwards to find an original or final value, but, geesh, it can be boring.  I looked around online and couldn’t find many activities for this topic, and the ones that I could were really geared toward lower middle school grades, so I decided to make my own version that is great for an 8th-9th grade class.

There are 17 problems that are to be posted, alphabetically, around the room (get creative, though!  can you hide any?).  Students work in pairs, each student getting their own work recording sheet.  Each pair of students also gets a path recording sheet, so they can track the order of problems they’ve gone through.  Students can start at any letter, that way you don’t have 30 students starting at the same place (I normally have a 4 person limit per letter).  Whichever letter a pair of students starts at will be the first letter added to their path recording wheel. They will solve the problem at the bottom, and then look around the room at the tops of the other letters until they find the letter with their answer printed on top.  Then, they go to the new letter, record it on their path recording wheel, and solve the problem at the bottom of the page.  The process repeats until the student makes it back to the letter they began at.

You can download the PDF and editable PowerPoint version of the scavenger hunt here.  You’ll need the fonts Wellfleet and HVD Comic Sans if you want to edit the PowerPoint file.  Otherwise, the PDF is good to go!

2-7-percent-of-change-scavenger-hunt-page-0012-7-percent-of-change-scavenger-hunt-page-0022-7-percent-of-change-scavenger-hunt-page-003

2-7-percent-of-change-scavenger-hunt-page-0052-7-percent-of-change-scavenger-hunt-page-011

My Favorite Resources #MTBoSBLAUGUST #Made4Math

Over the last year or so, I’ve done a lot of work with very low-end students.  Between teaching summer school for two years straight in the inner city, and teaching support classes in my regular semi-rural school, I’ve really been pushed to find other ways to convey information that work for my students.

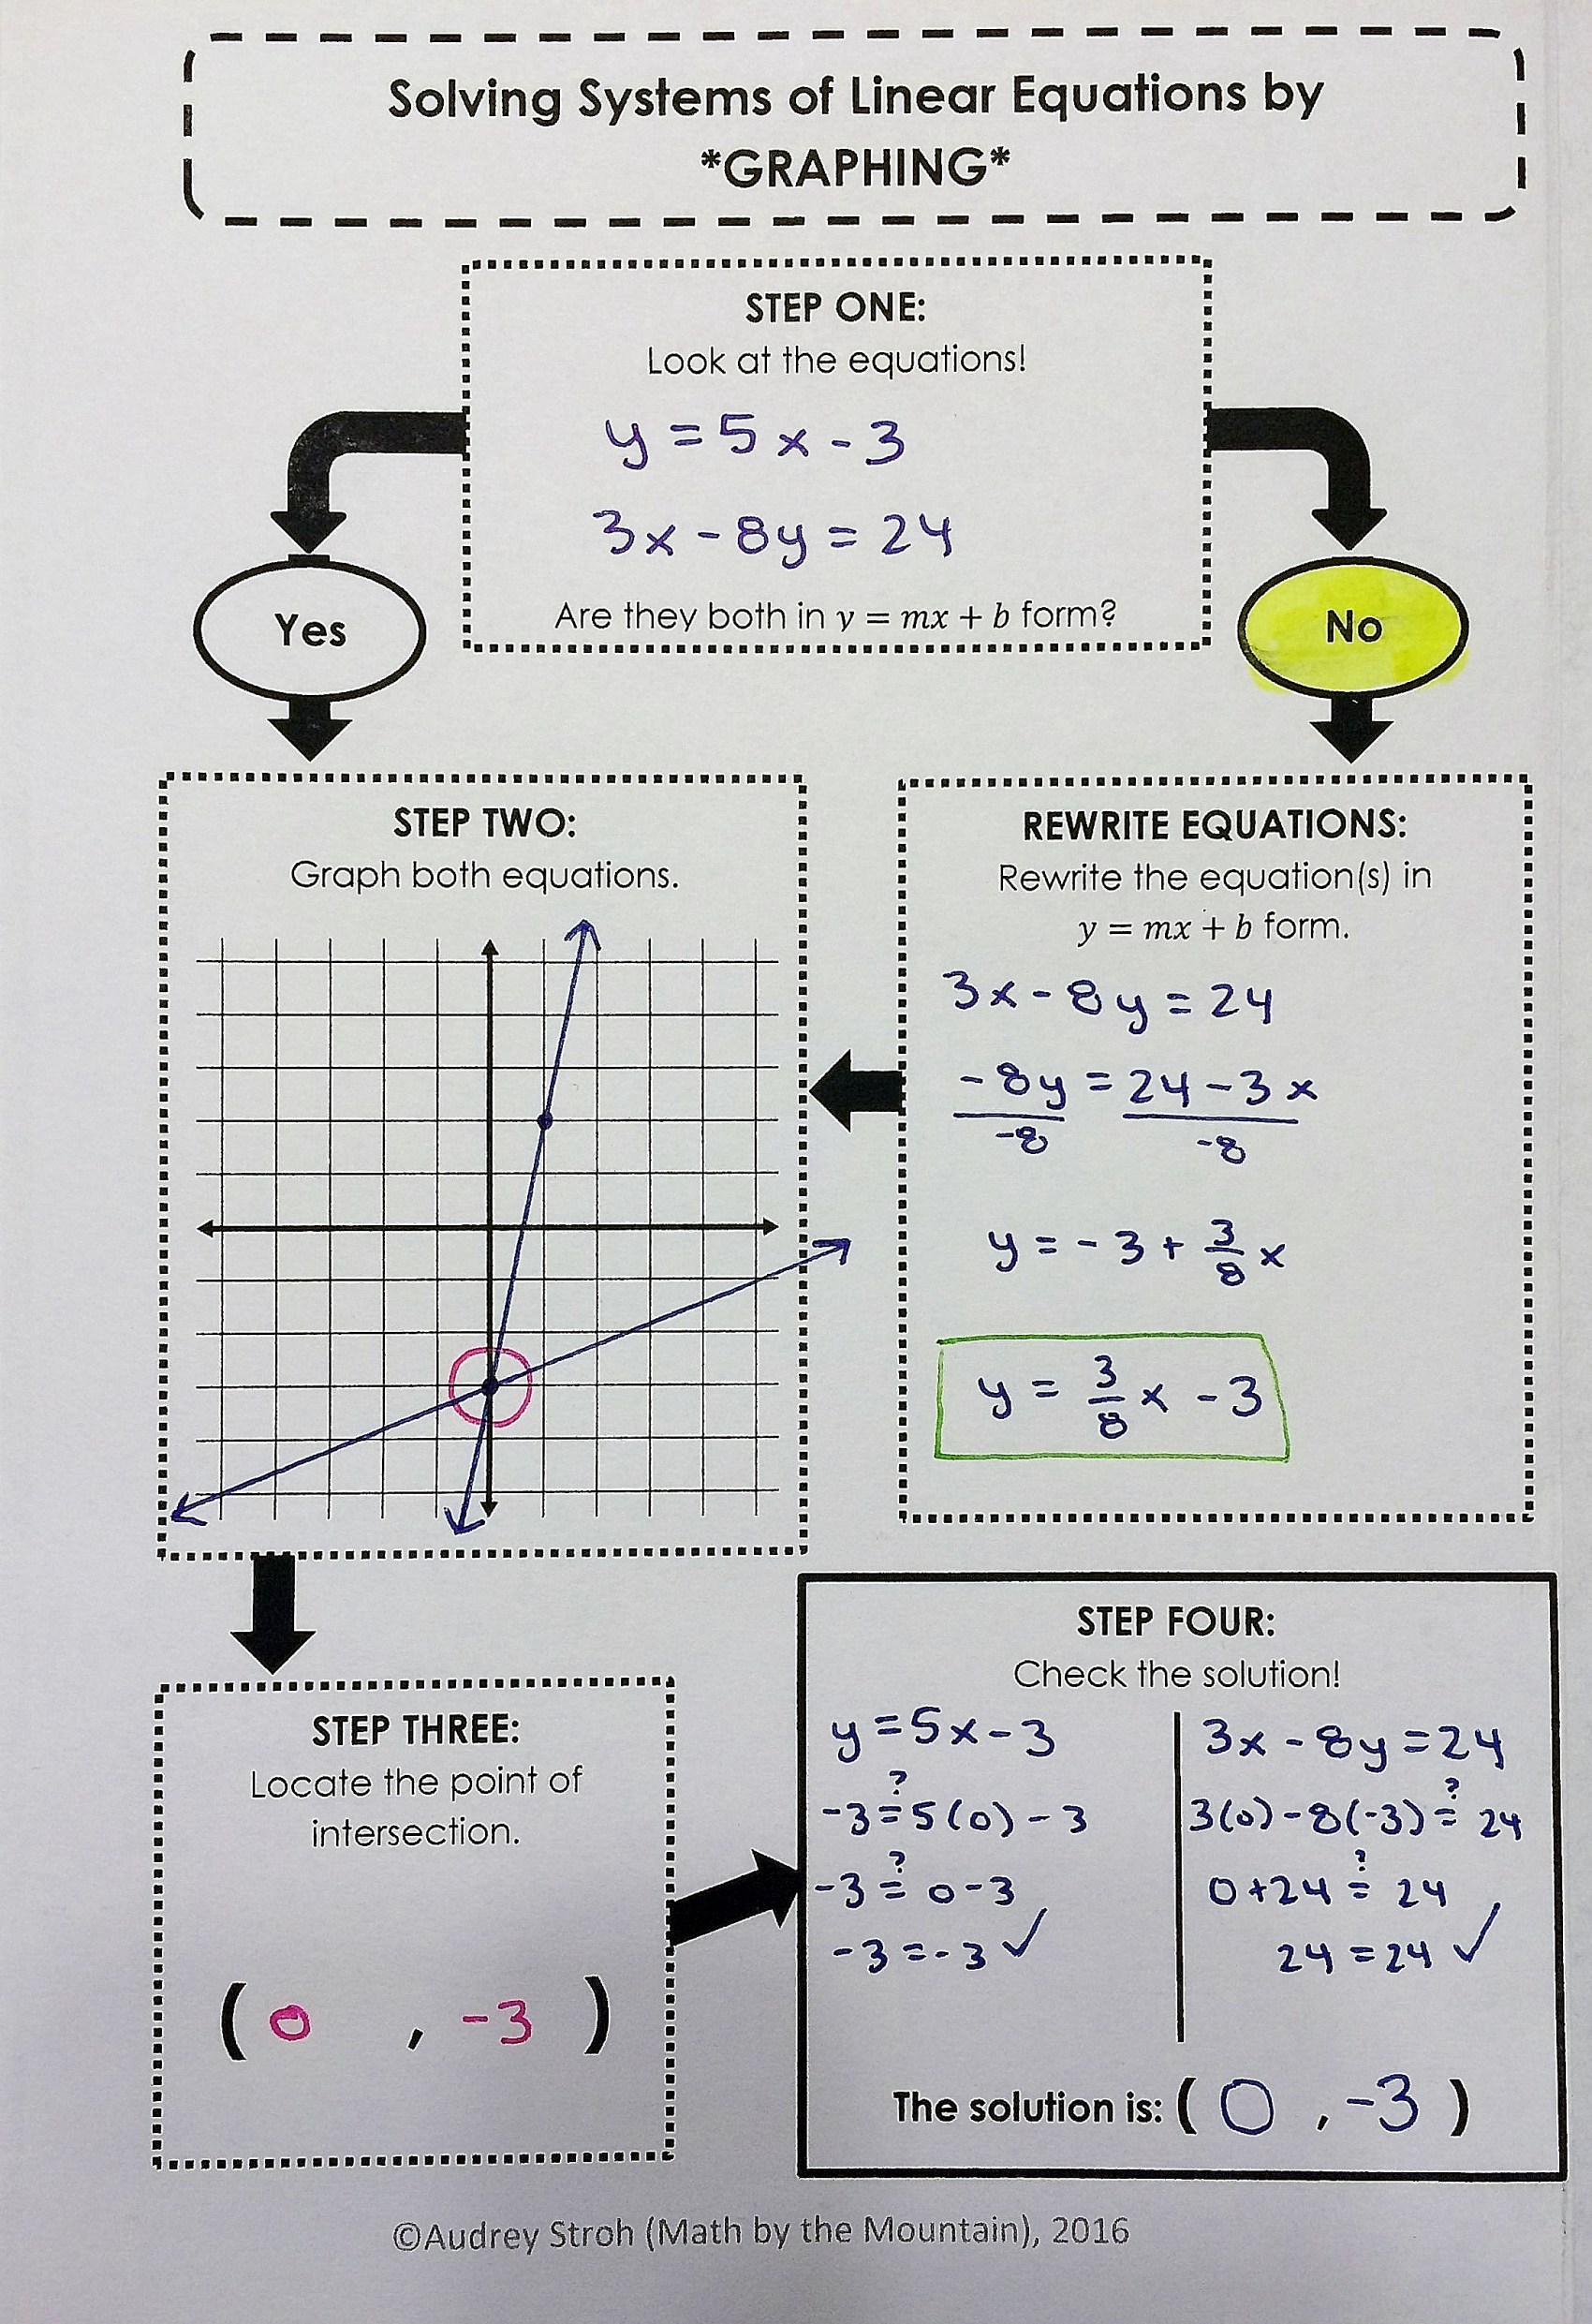
One thing that I found is that no matter how small and bite-sized of steps I could break a process down to in our notes, many of my ELL students and students with IEPs for processing disabilities just couldn’t follow along and rework through the steps to get themselves “unstuck” on a problem.  Working toward self-sufficiency is really big for me.  I strongly believe that the purpose for high school is to prepare students to be productive once they enter the “real world,” whatever that means for them (school, workforce, military, etc.).  Being self-sufficient and being able to problem-solve on their own is a big part of being able to reach this point.  So, I kept searching and trying new things until I made my first flowchart graphic organizer.  It was a game changer for my class!

IMG_0146 (768x1024)

Picture1

Picture2

Students were able to easily follow along.  Using the graphic organizer, they were forced to read and do only one small chunk at a time and they had enough space to do their work right on the flowchart (it’s hard for some students to go back and forth between where the steps are written and where they’re doing a problem on a separate page of paper).  Students were able to use the flowcharts as long as they wanted.  As soon as they felt comfortable enough without it, they stopped using it.  I have also laminated a class set that we used for practice early on.

3

1

2

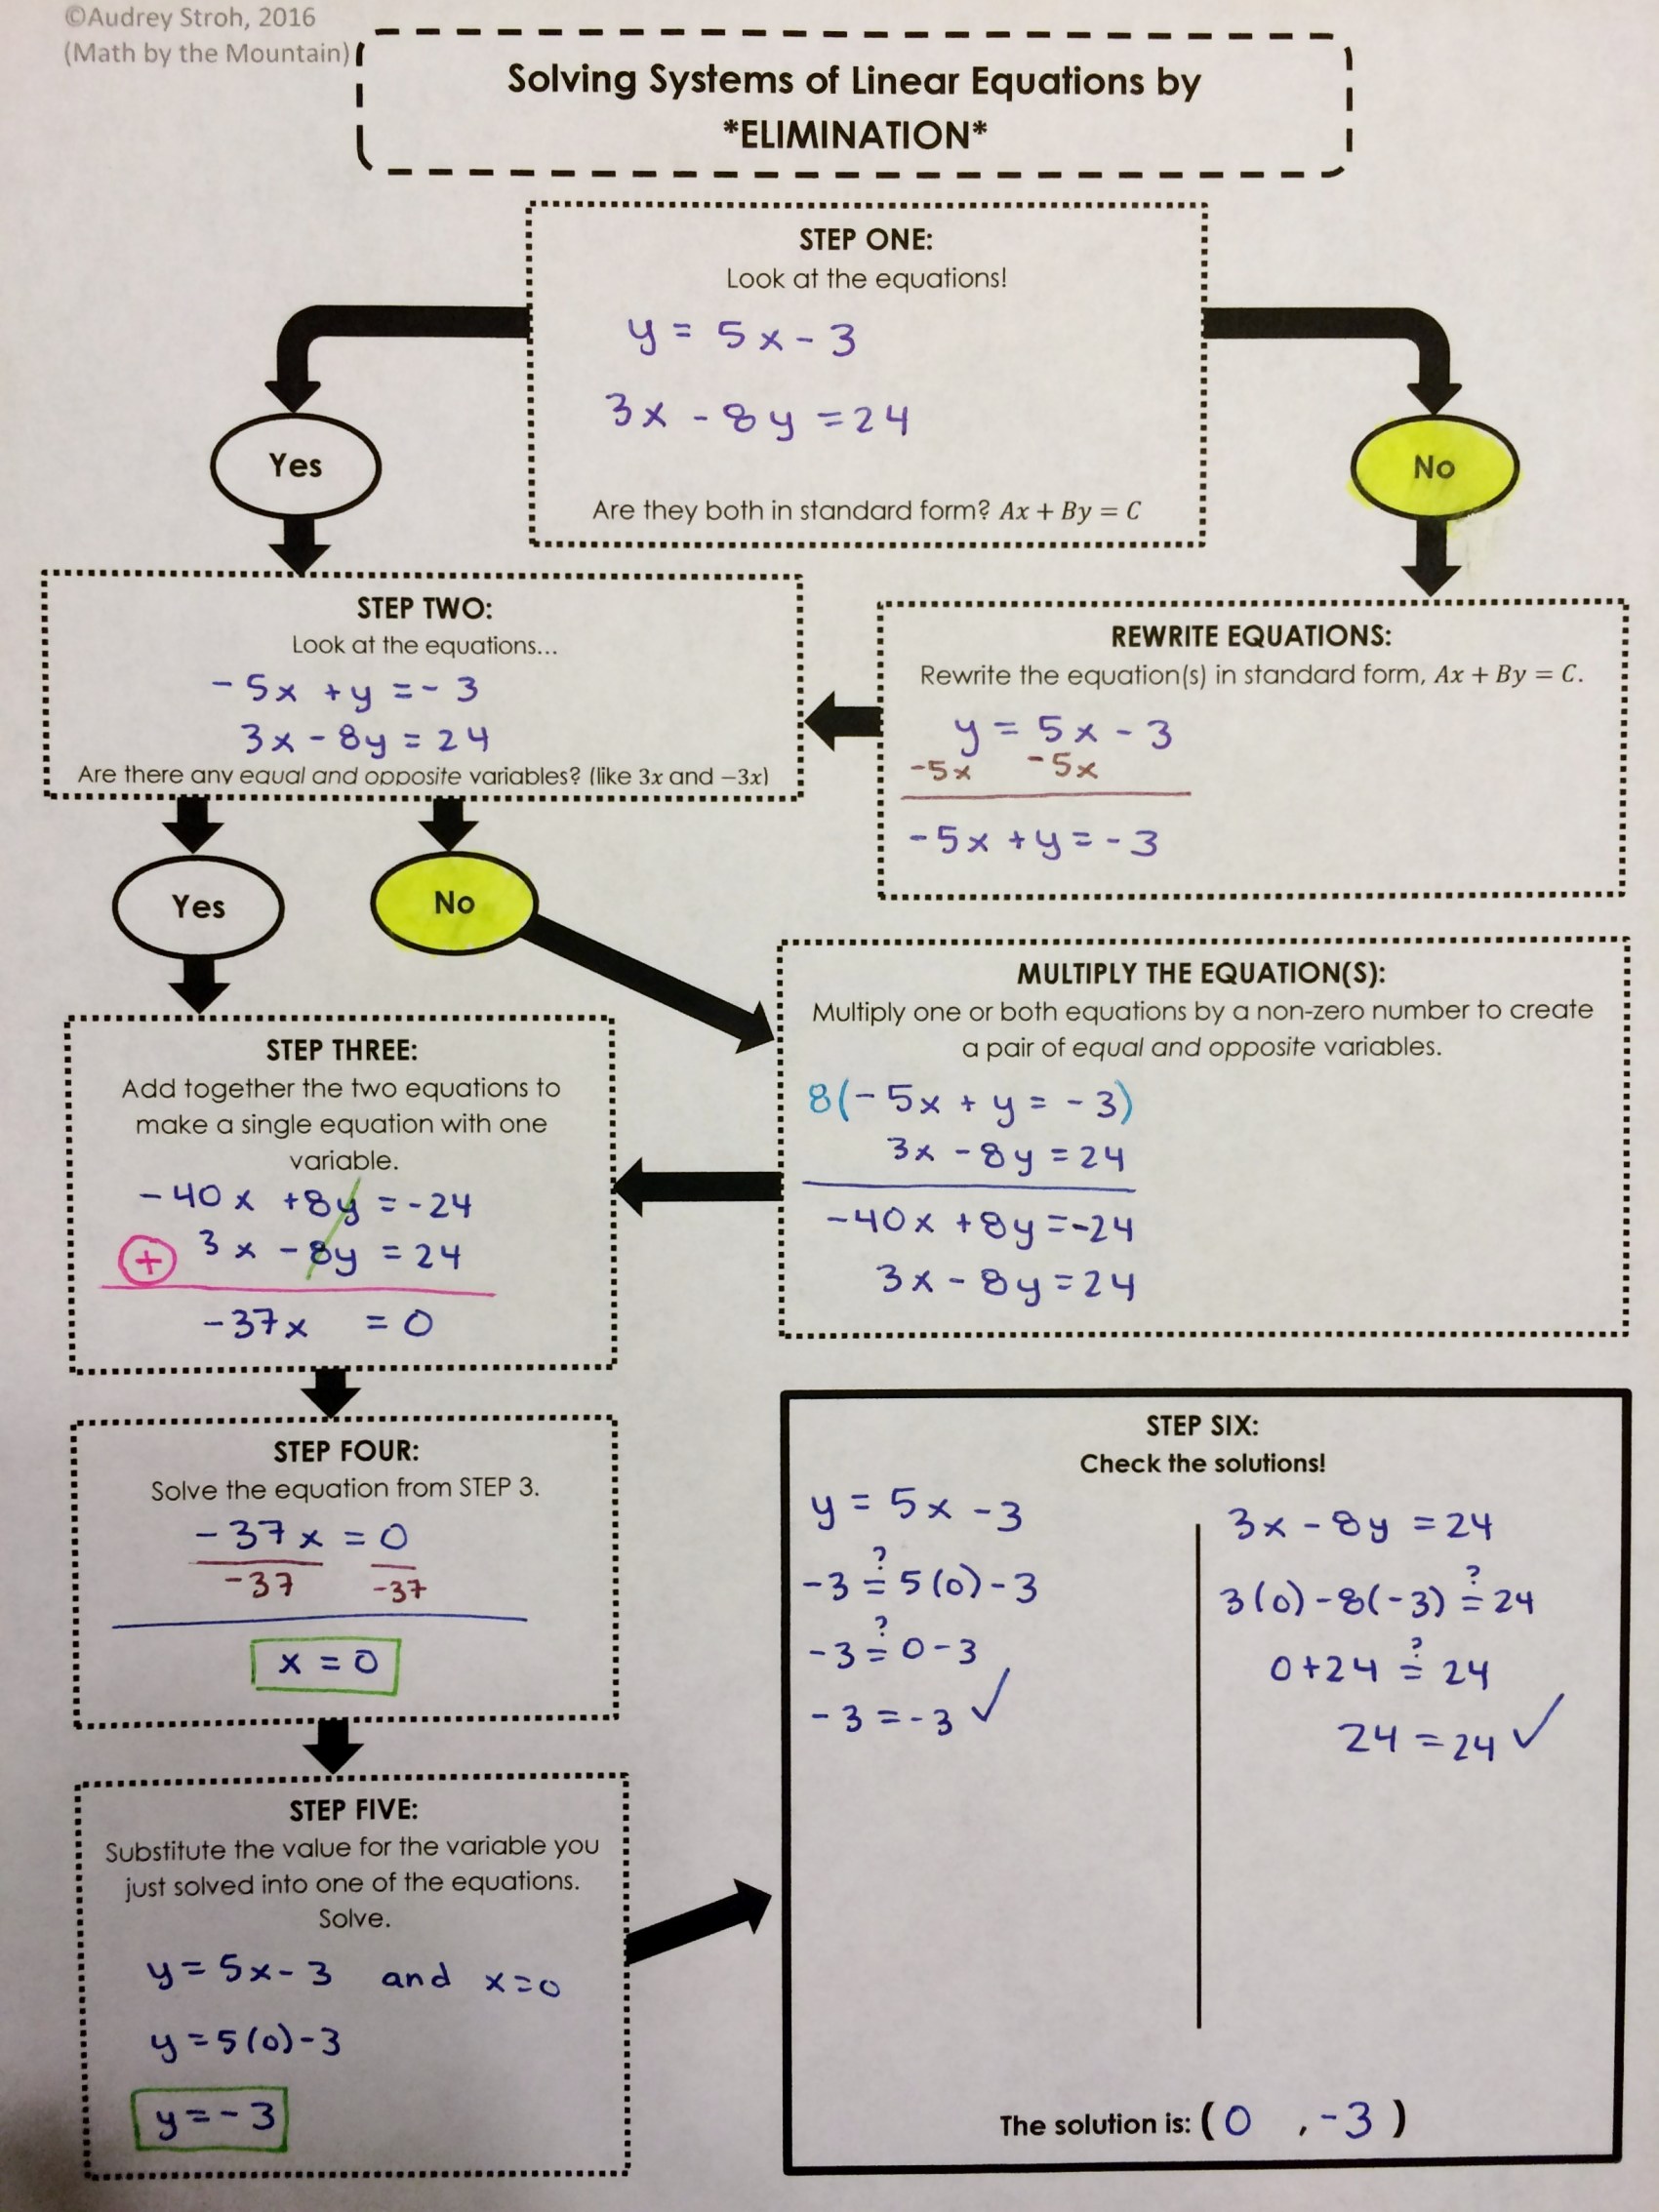
I’ve also found that these have been very successful with my older students to jog their memories about a method they haven’t used in a while (such as solving systems by elimination).  For a lot of my seniors, I’m not the only math class that they are taking–many of them are also taking a class called Math Skills that gives them opportunities to take more Work Samples, which are needed for graduation.  Work Samples are an animal of their own and the topics on them can vary widely, so students find themselves needing review on topics that they may have not seen for a couple of years.  I’ve had a lot of these students specifically ask if I had a flowchart for topic _______ that they could look over to remind themselves of the details of how to do ________. 6
9

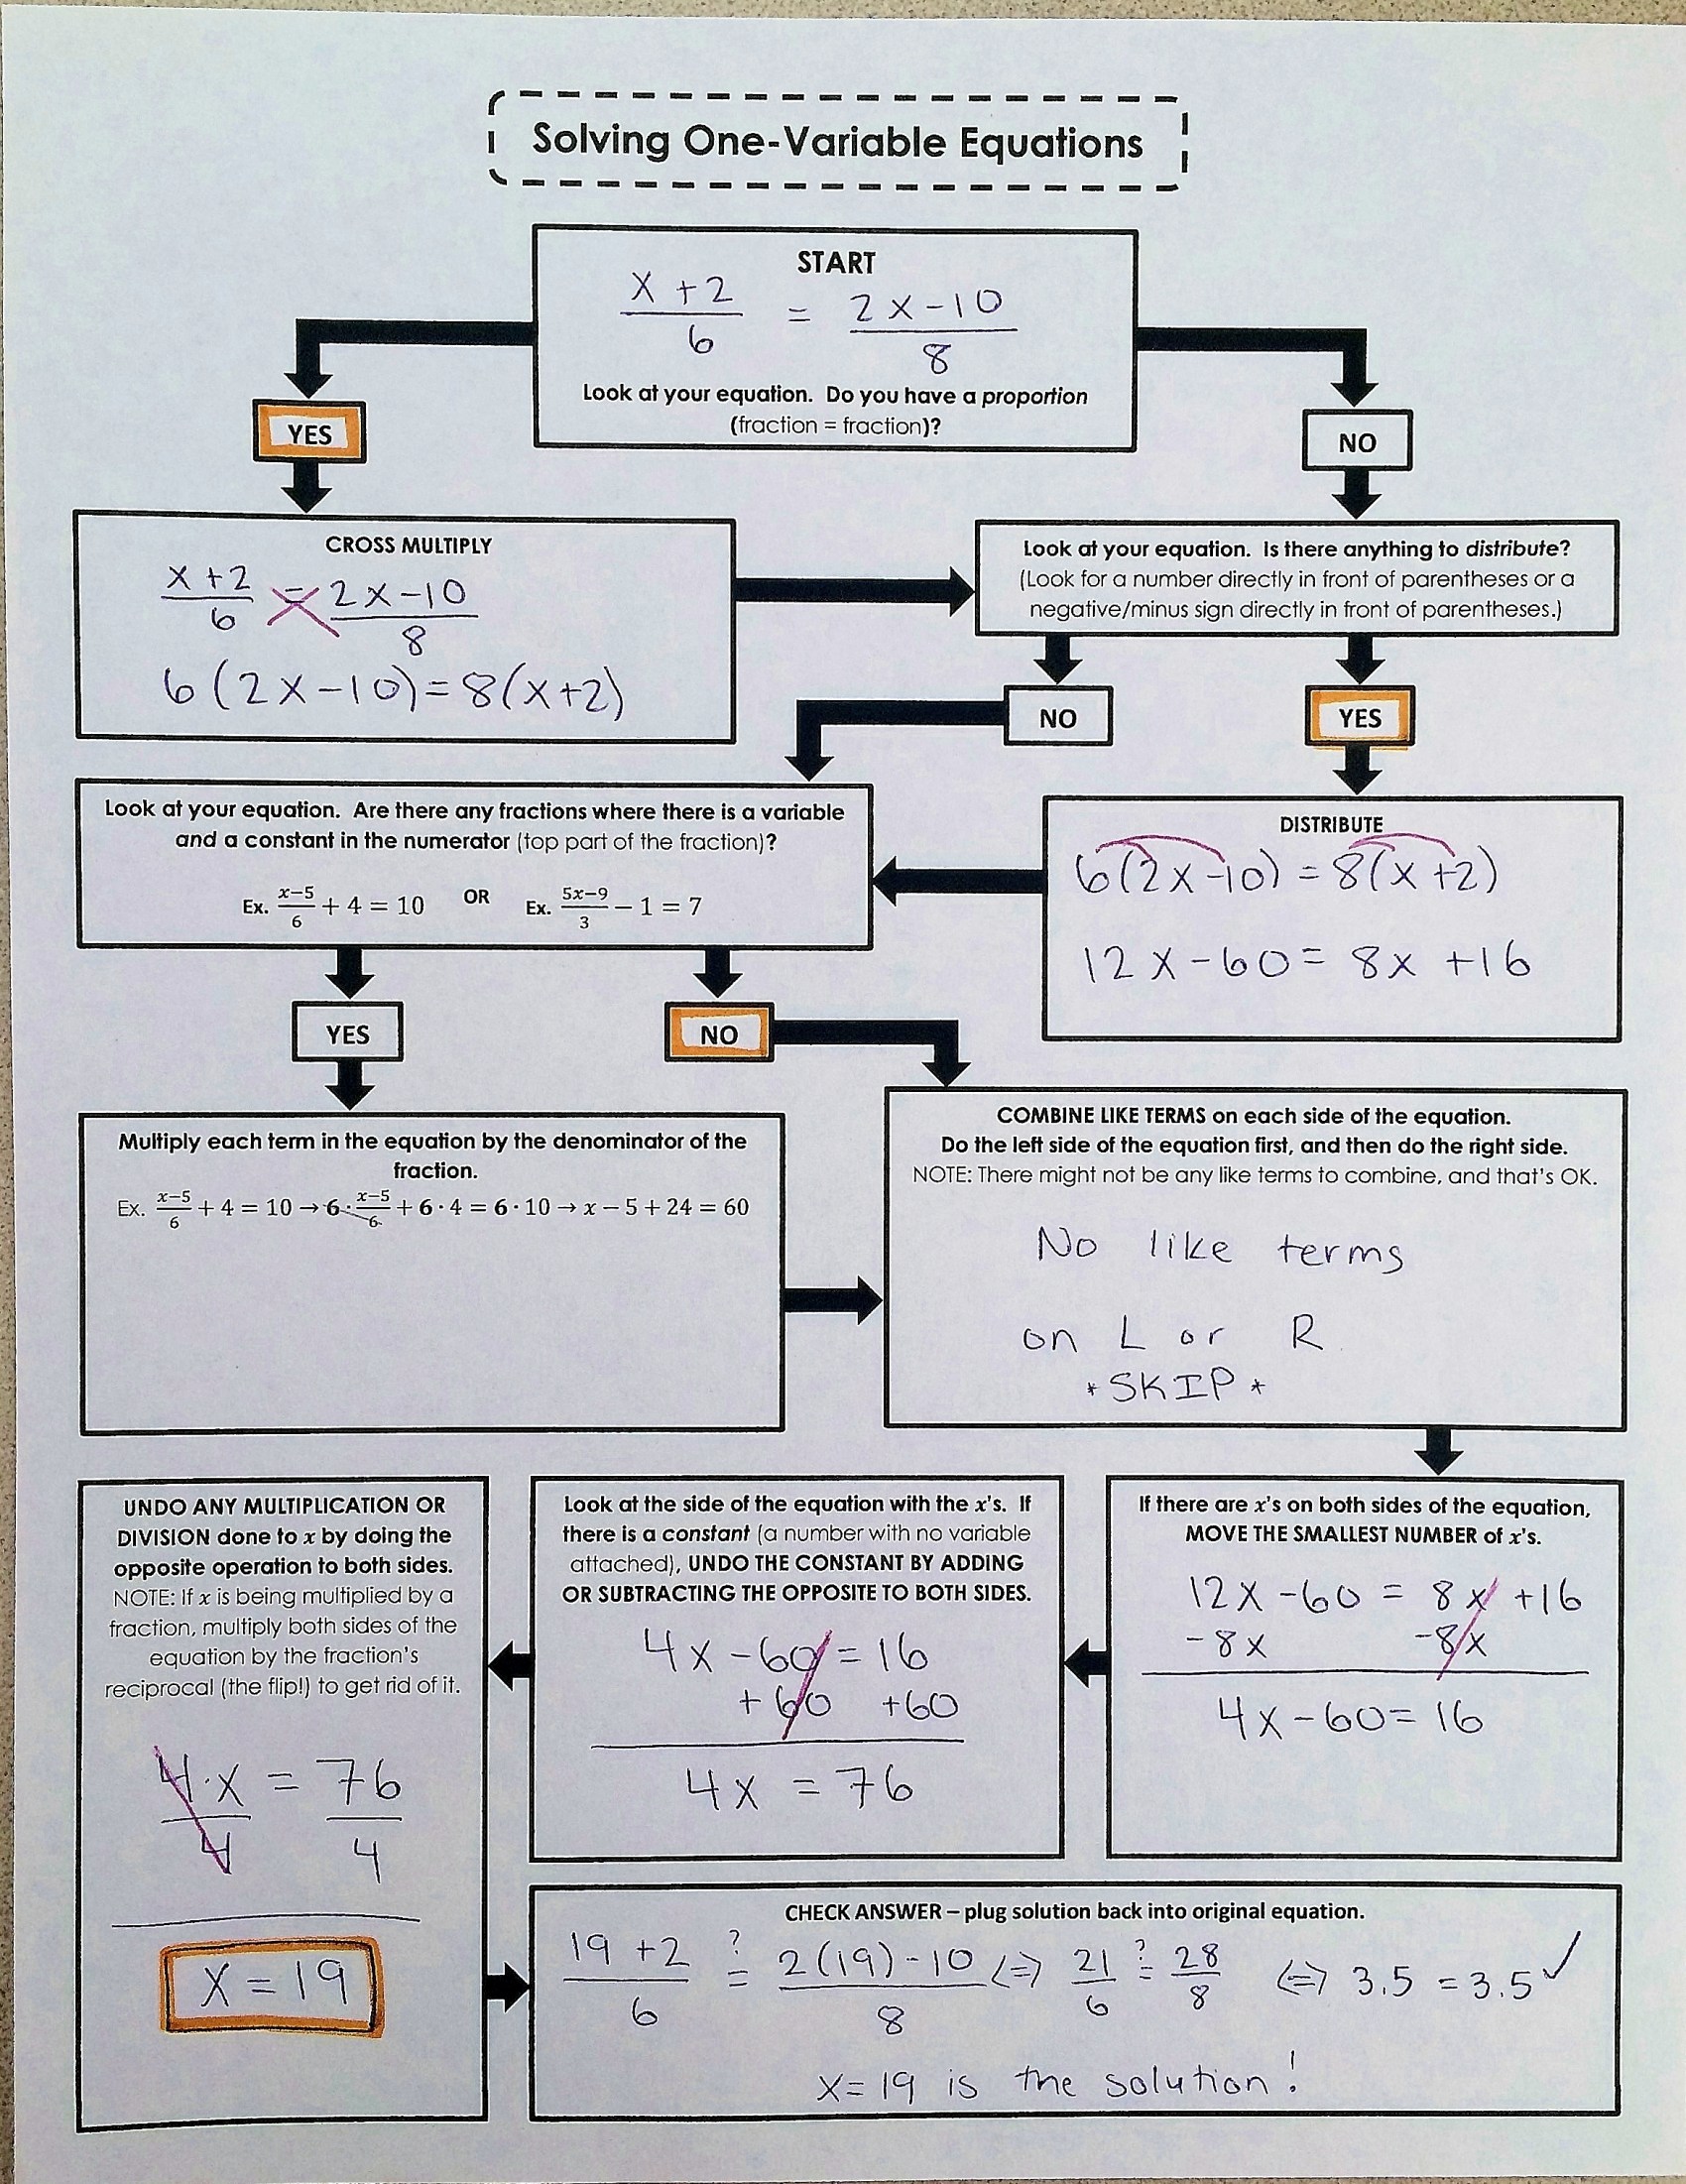
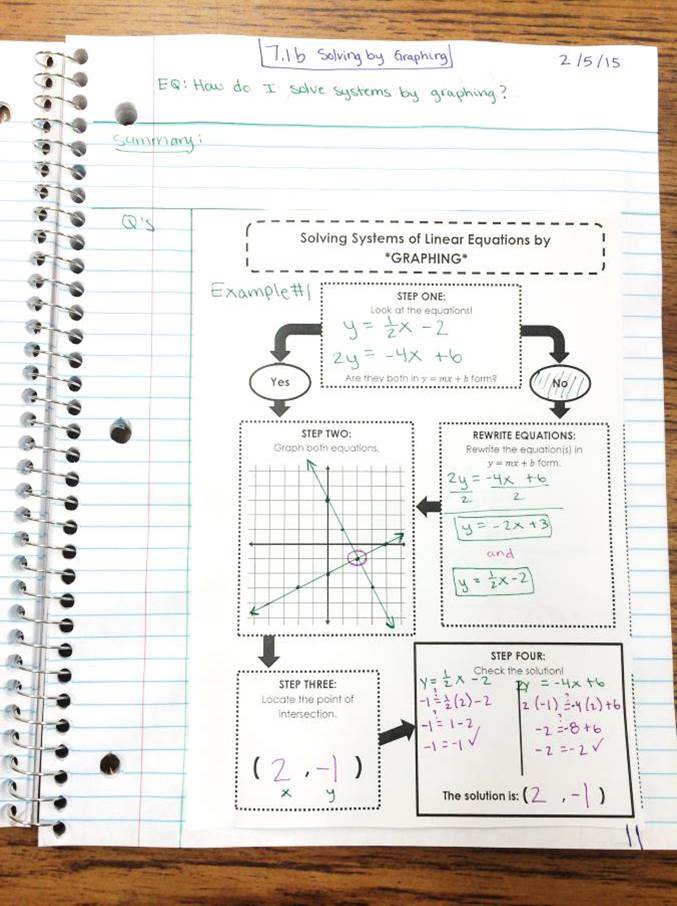
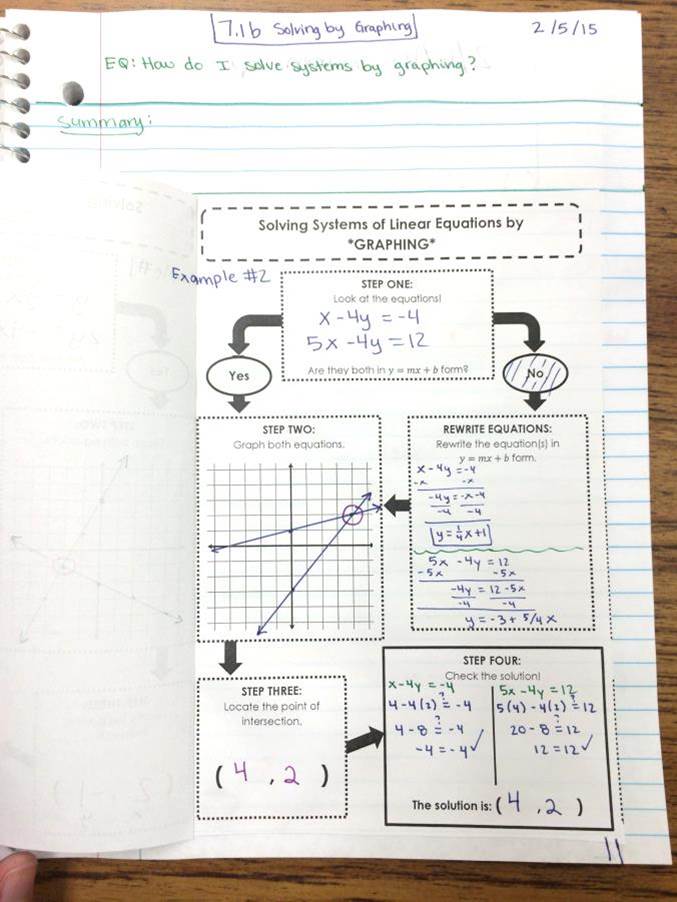
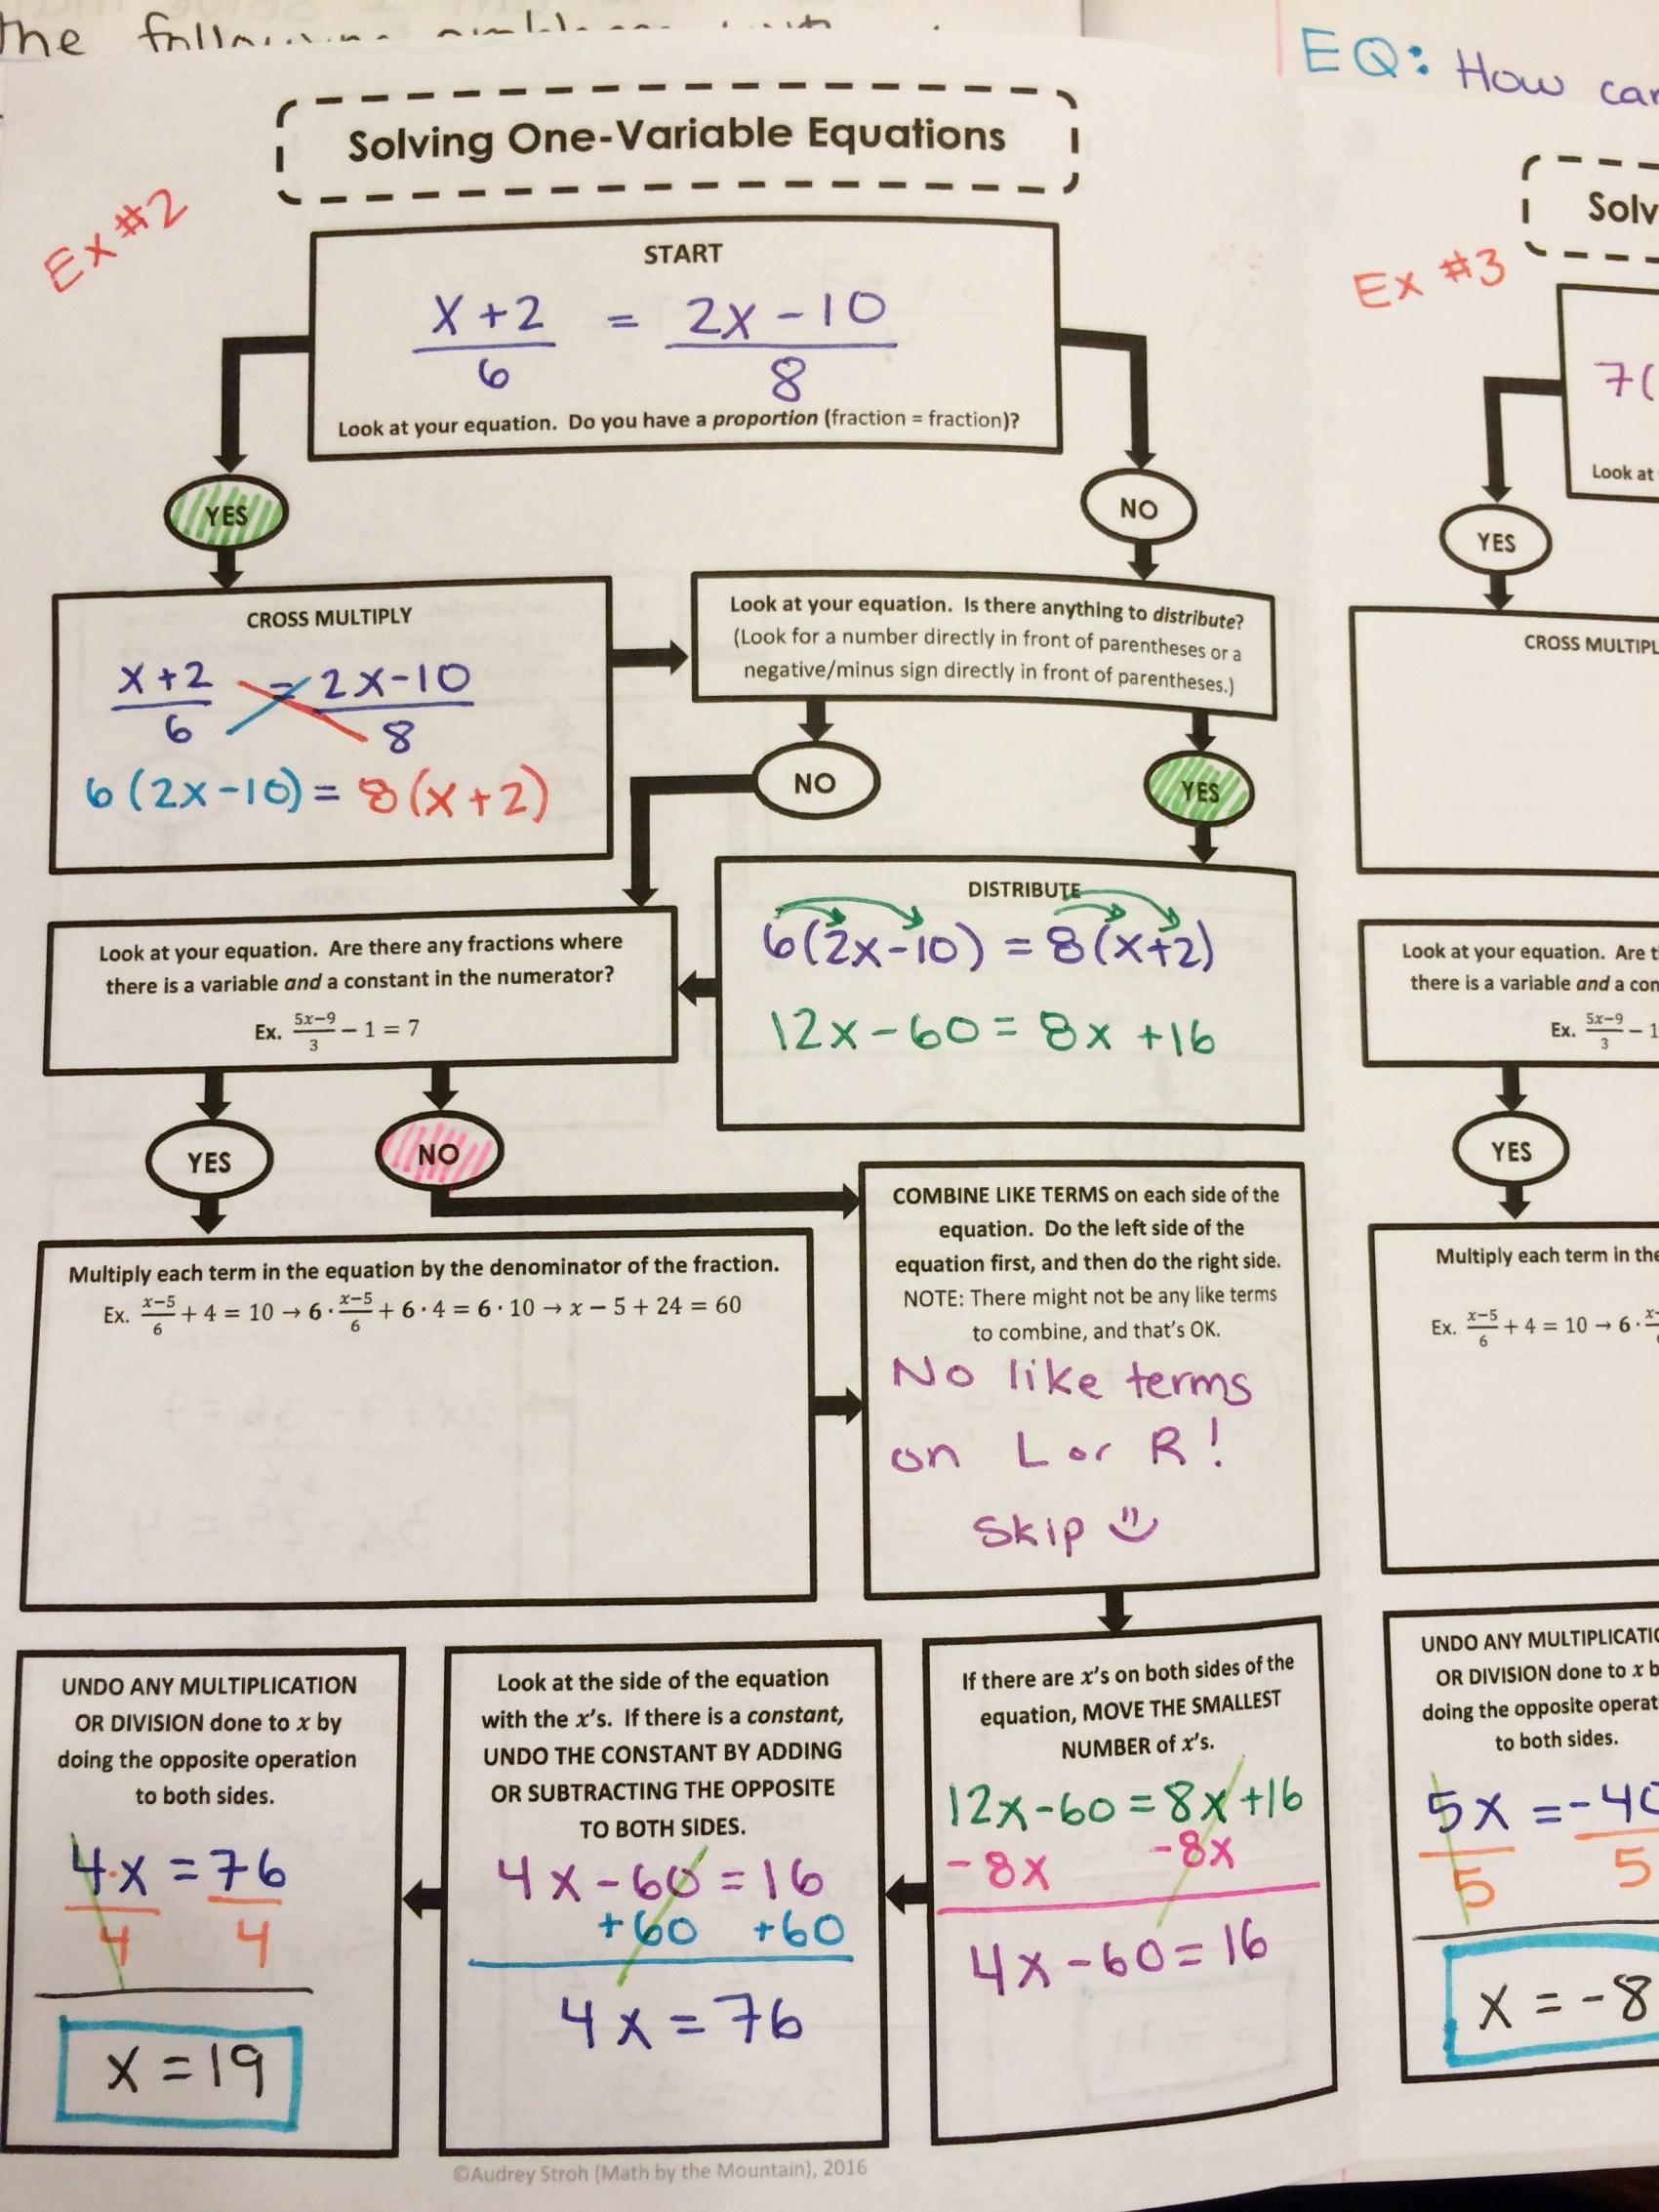
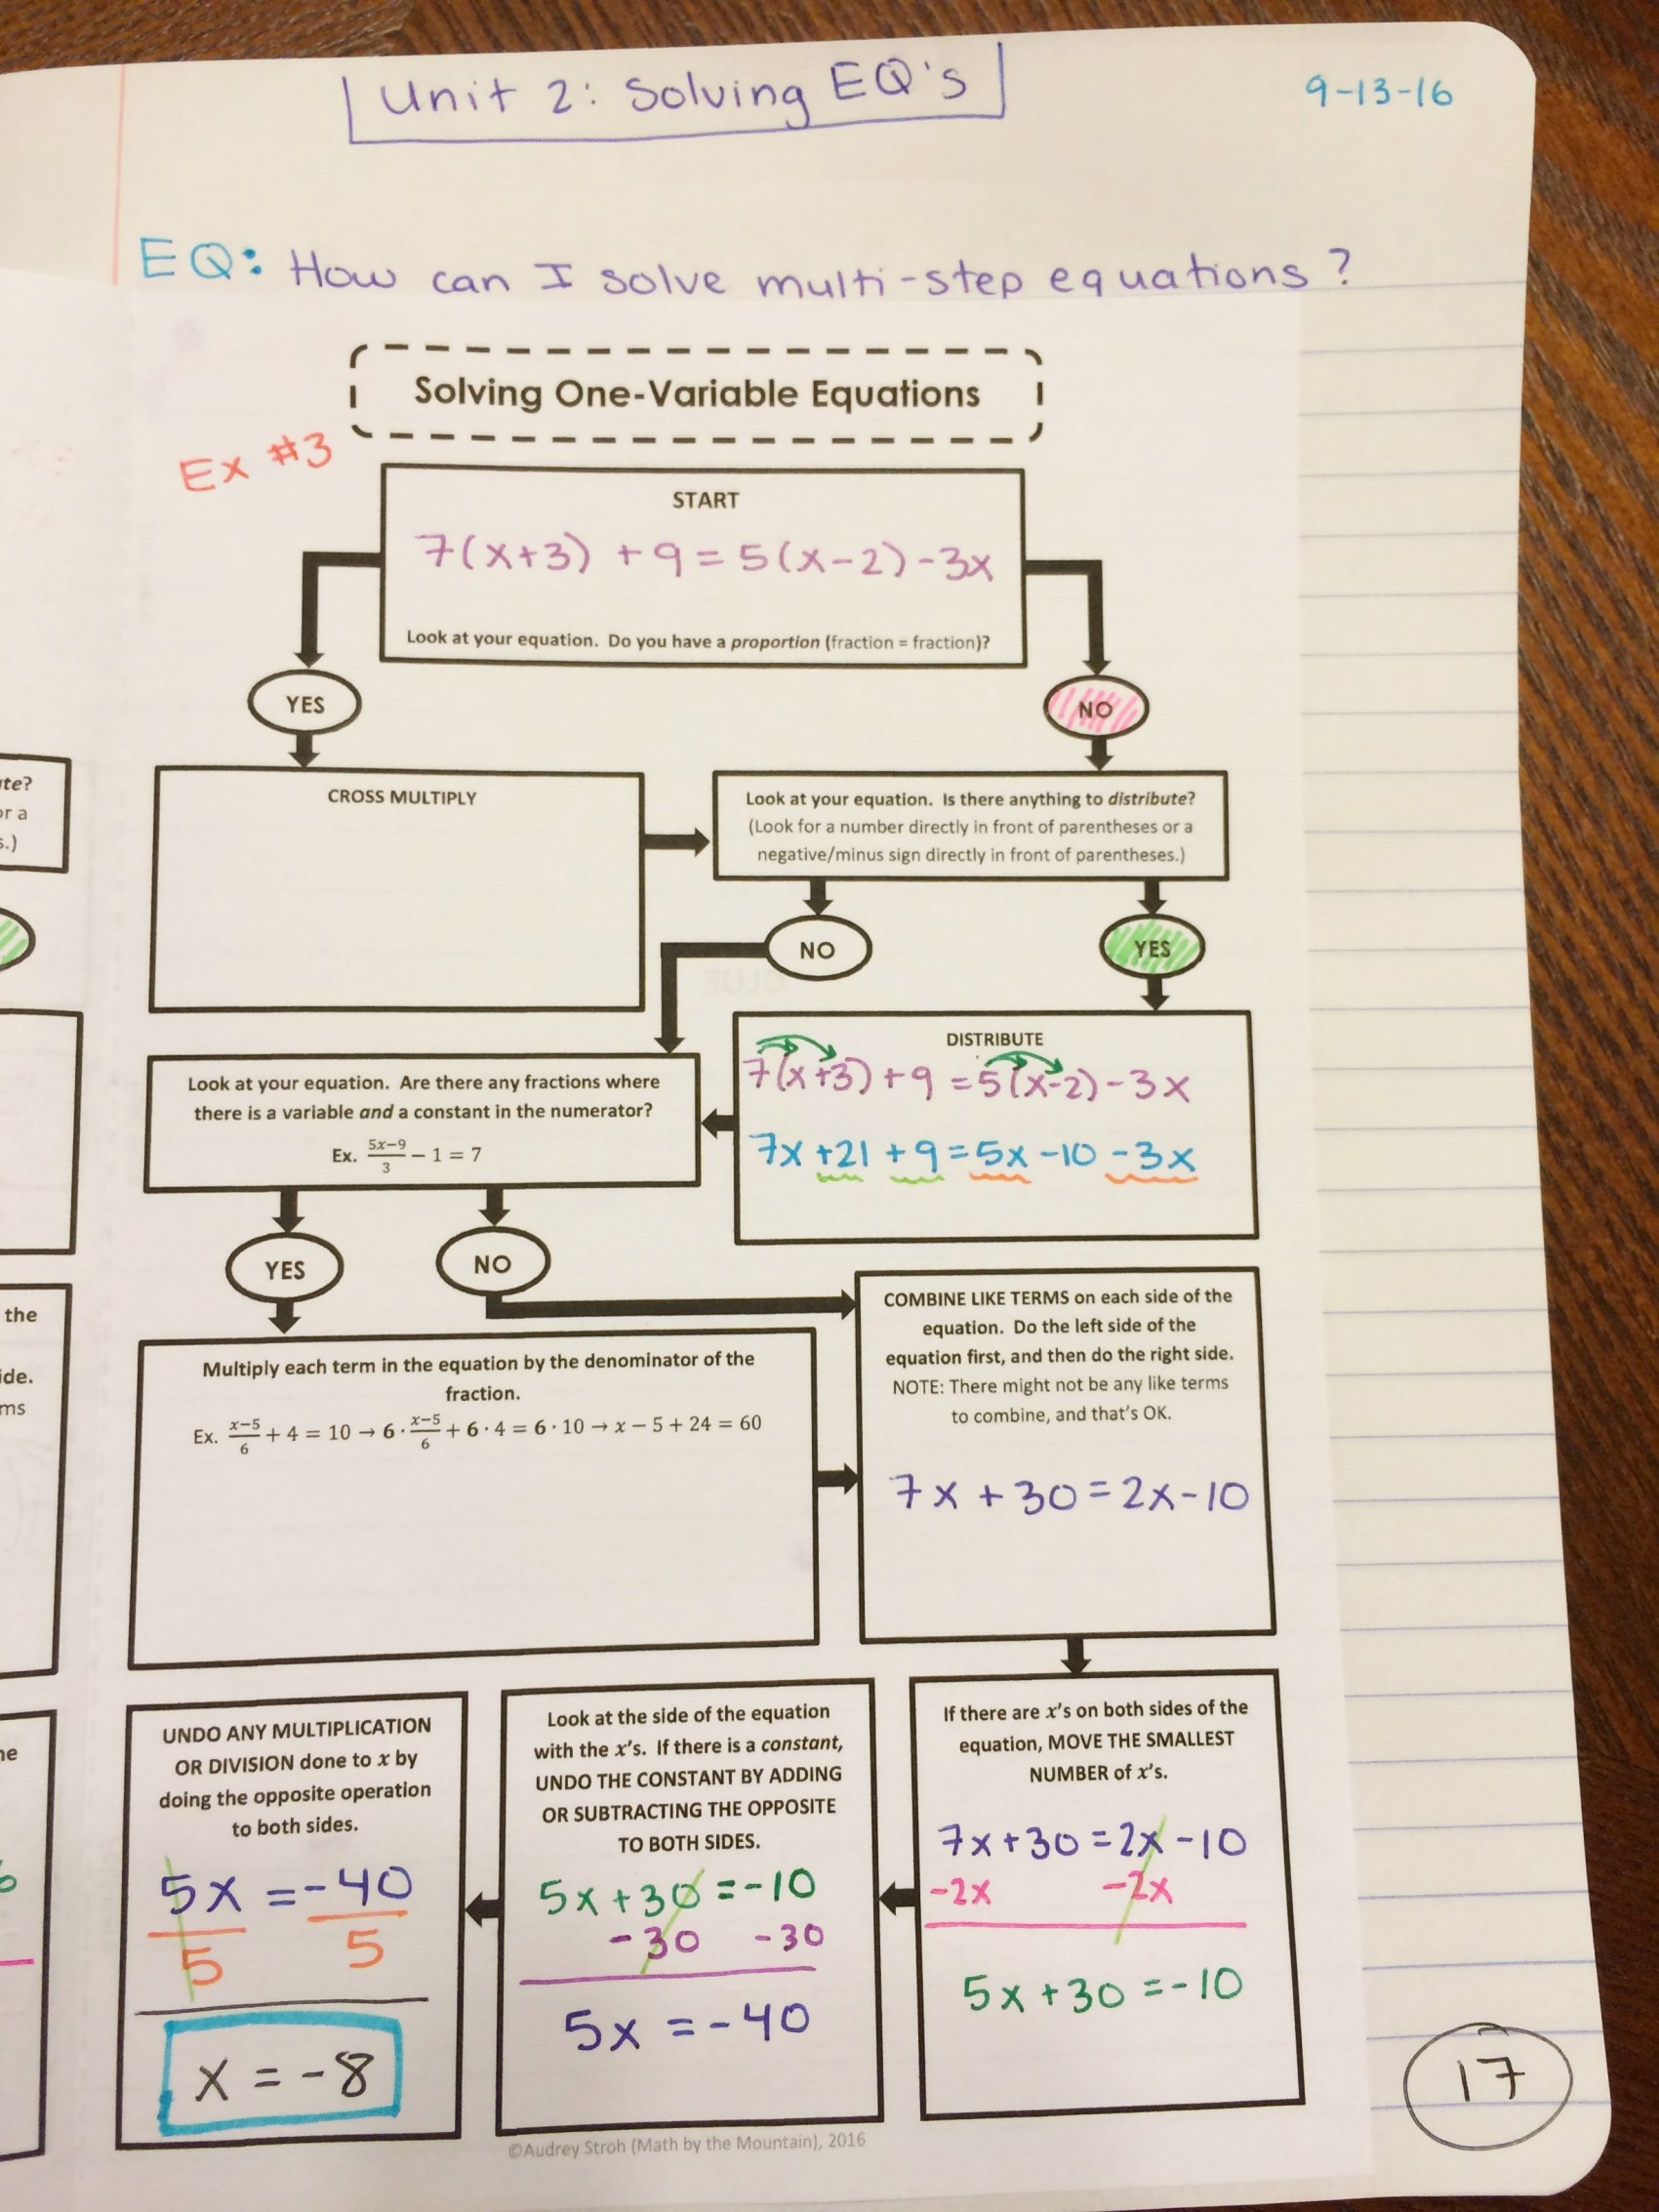
With my younger classes, the first time we learn a method, I have a student working at the document camera as our class’ scribe, and the class (no help from me) discusses their way through the problem.  They determine which path they need to go down (the “yes” path, or the “no” path), and then work in pairs to do that step.  Then, they compare their work for that step as a class, and then move onto the next part of the flowchart and repeat the process.  I love, love, LOVE how student and discussion centered this makes my lessons!  Seriously! LOVE!  It’s almost as if I’m not needed (shh! don’t tell anyone that, because I still want my job).
IMG_0145 (768x1024)
IMG_0147

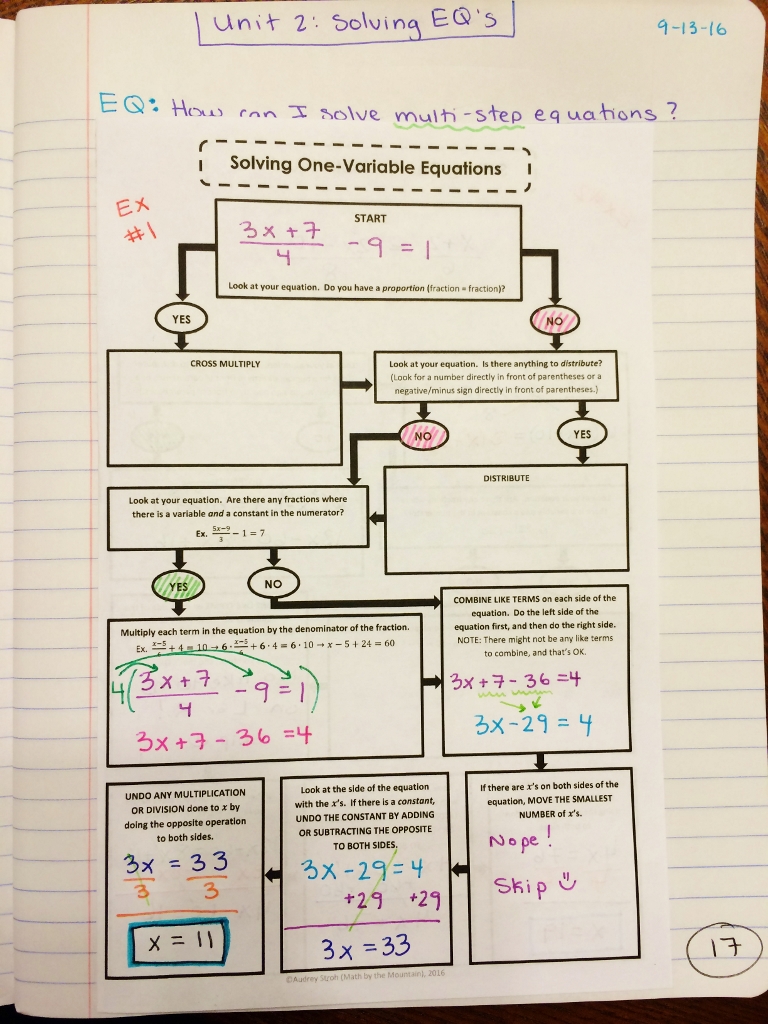
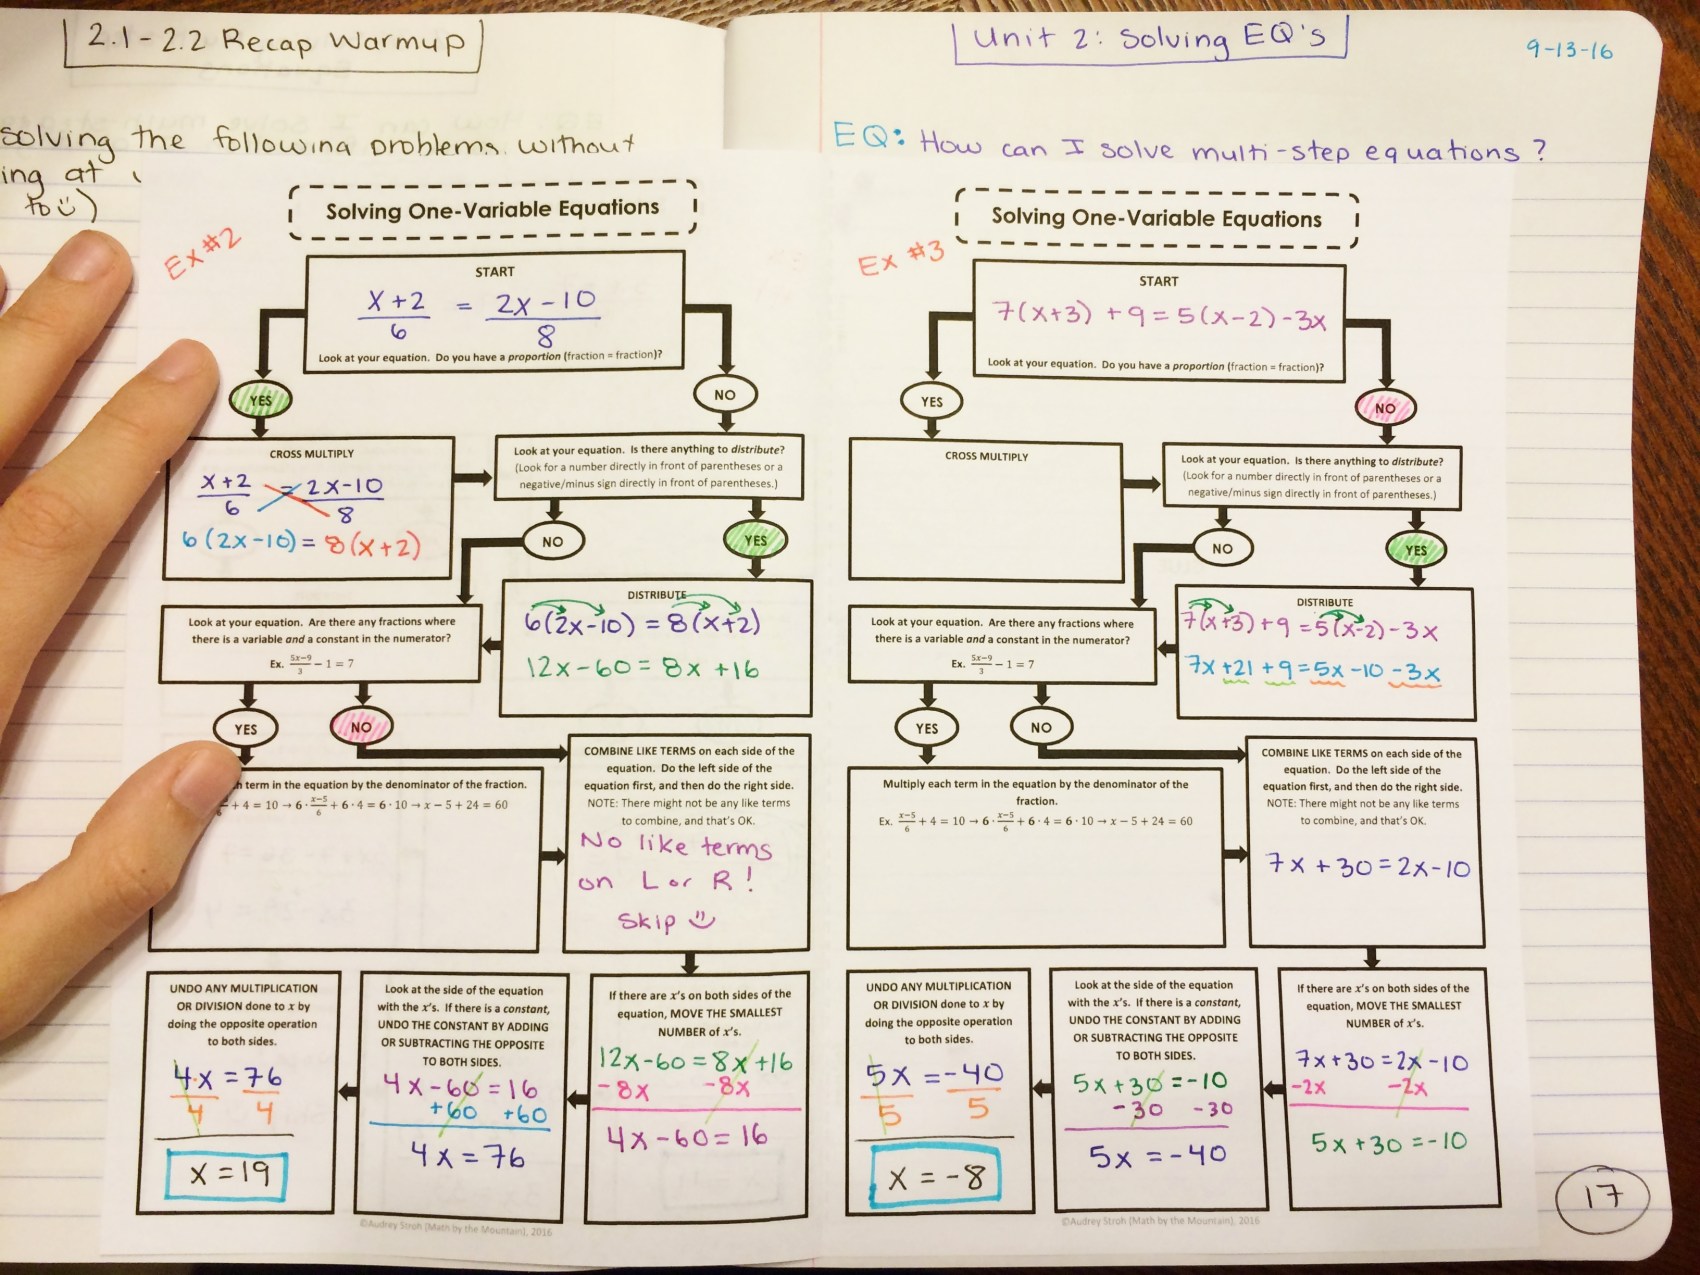
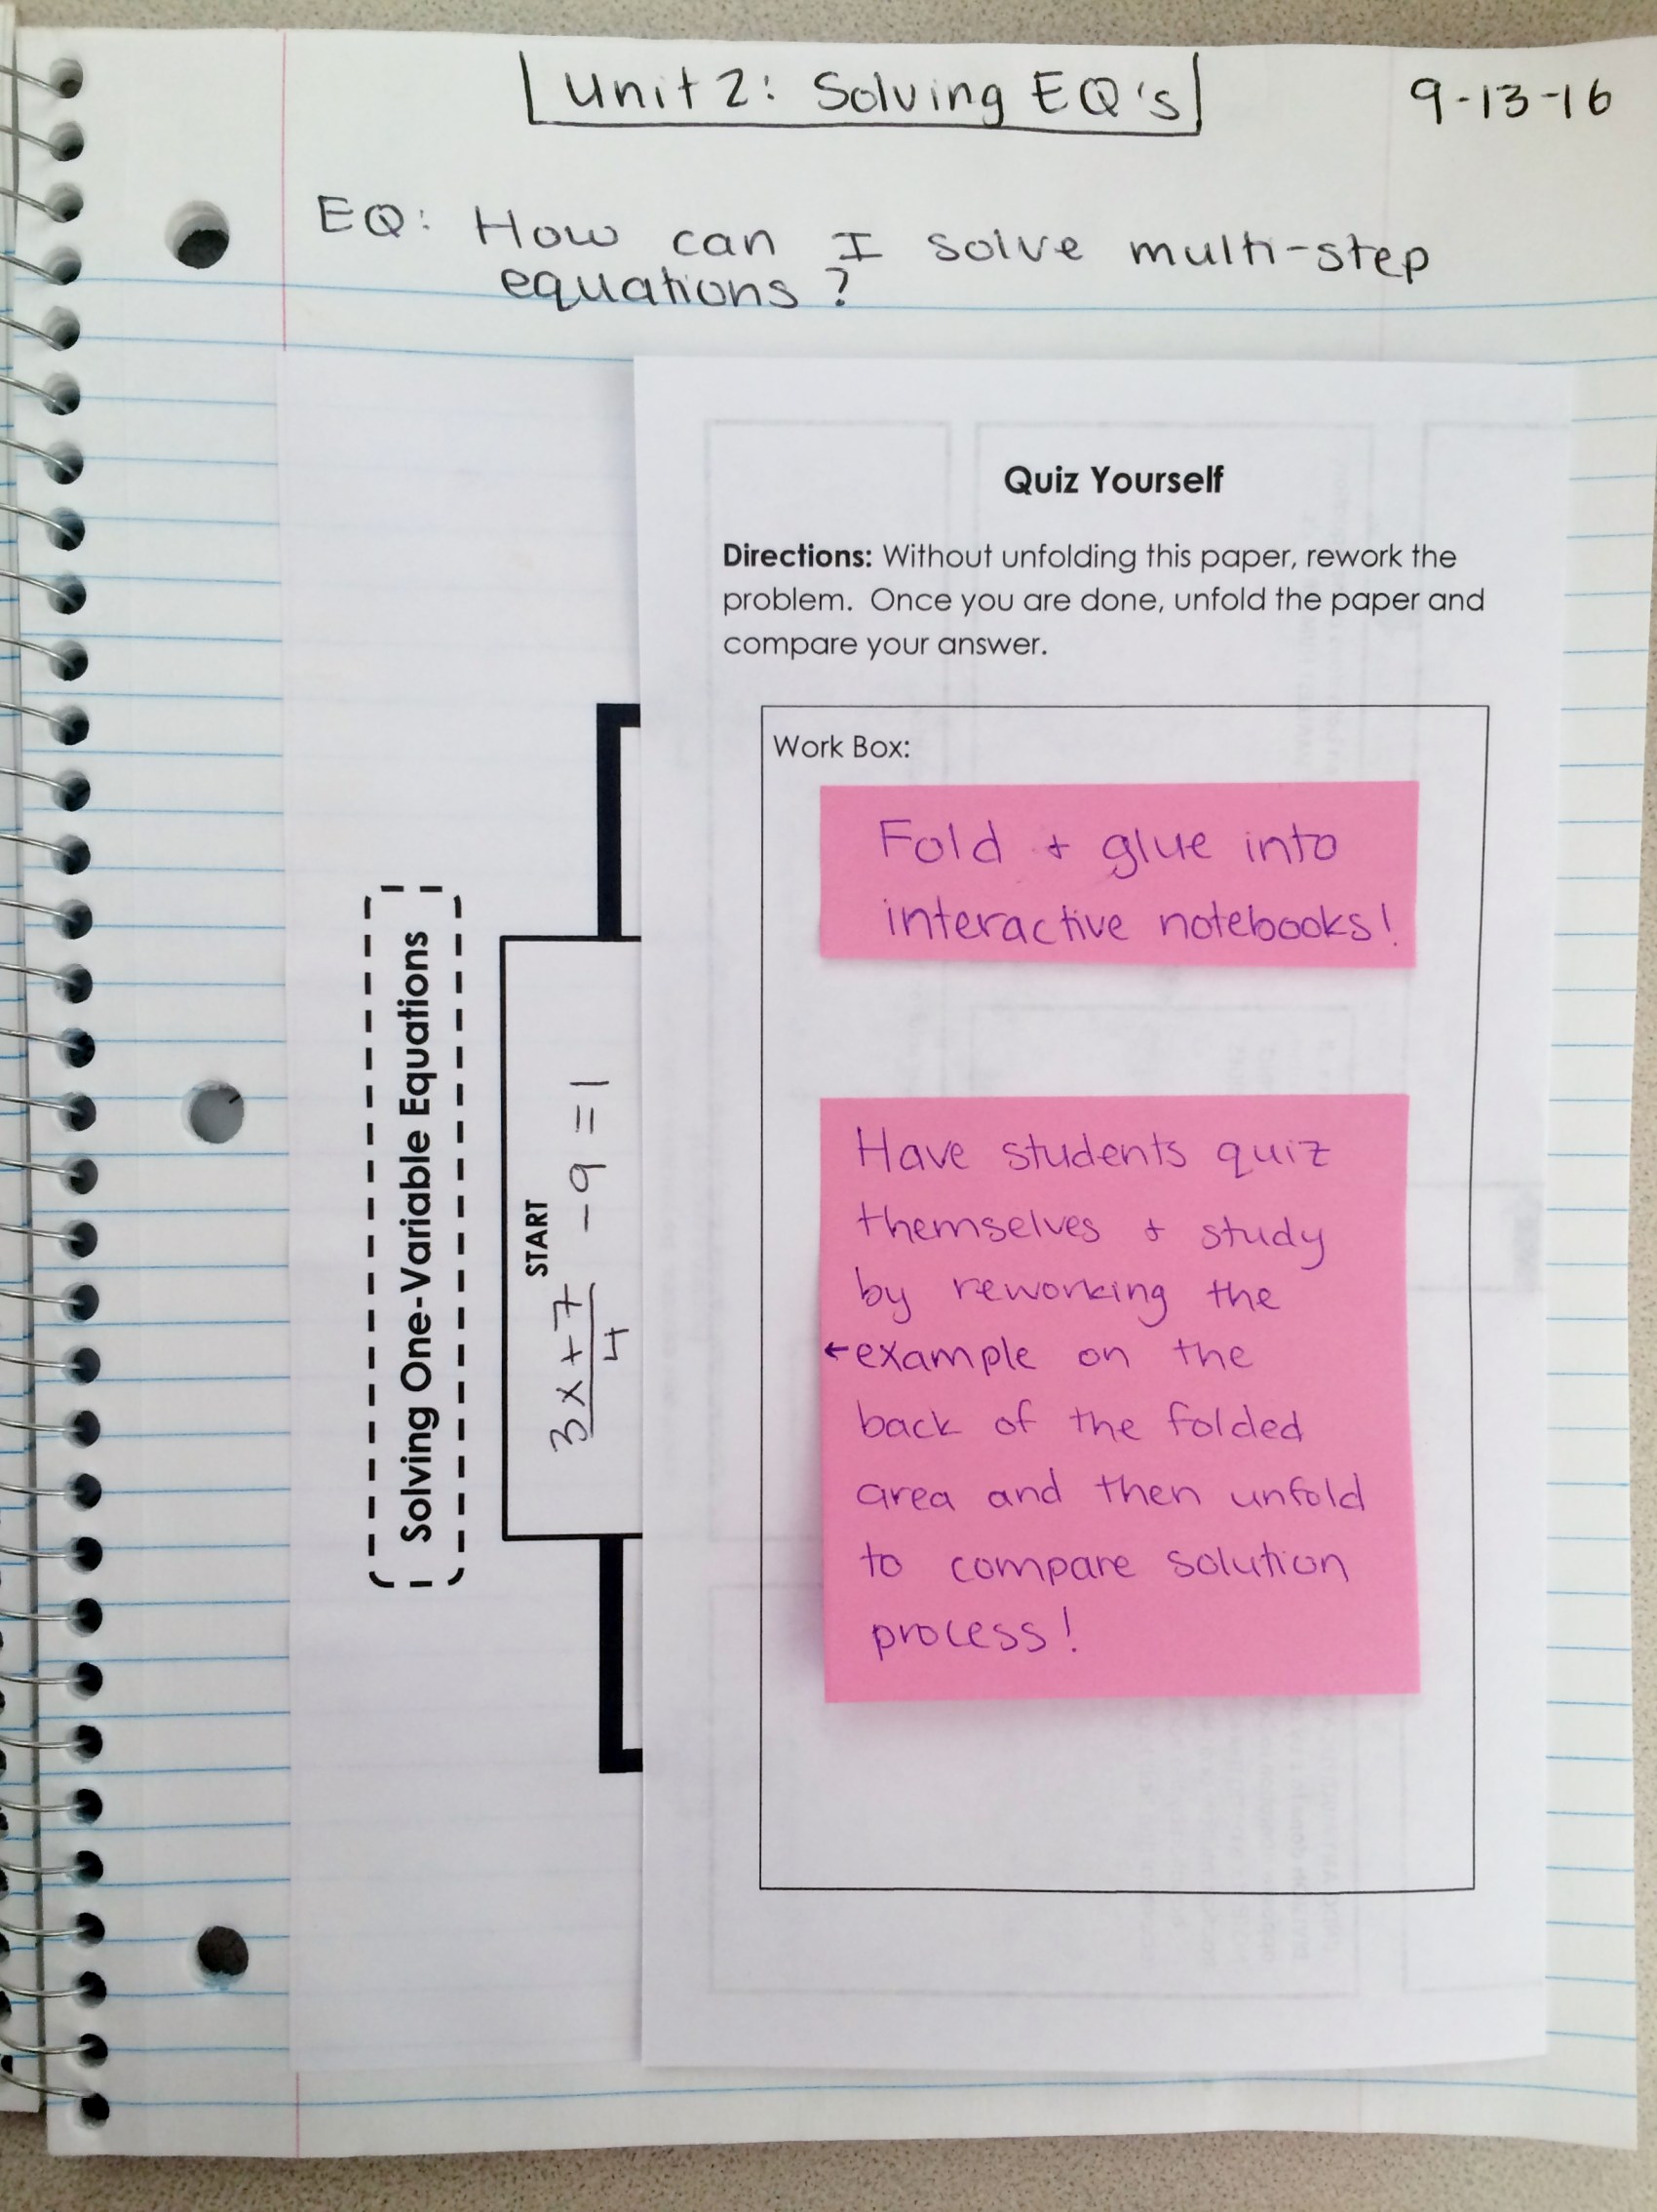
From there, we do a few examples that we glue into our INBs, and do some practice with dry-erase pens on the laminated copies of the flowcharts.  I find that starting slow and having them work their way through a problem as a class, without me, helps them remember the ins and outs of the process a bit better, since they had to struggle together as a class.
IMG_0148
IMG_0149

Although I don’t have students referring to their notes quite as much as I would like, I have found that they go back to these flowchart examples in their INBs more than anything.  When I ask my students why they like these so much, a lot of what they say comes back to the fact that they have the steps on the paper, and the space to do the work on the paper, and the flowchart really forces them to go one step at a time.  A lot of them know that they have a tendency to rush through steps, and using the flowchart makes that very difficult to do.  Students then self-wean off of the flowcharts at their own pace, which is great in my books!  They are taking accountability for their knowledge.  If they can do their work straight away, they do so.  If they need a bit more help to get through a problem, they don’t just give up–rather, they walk to where I keep extra copies of the flowcharts, grab one, and work through the problem.  This has really helped develop the no opt-out culture in my classroom.  If students want to learn, there are tools to help them learn.  For my classes, the flowchart has been an instrumental tool for their development, both in math skills as well as self-motivation and persistence.

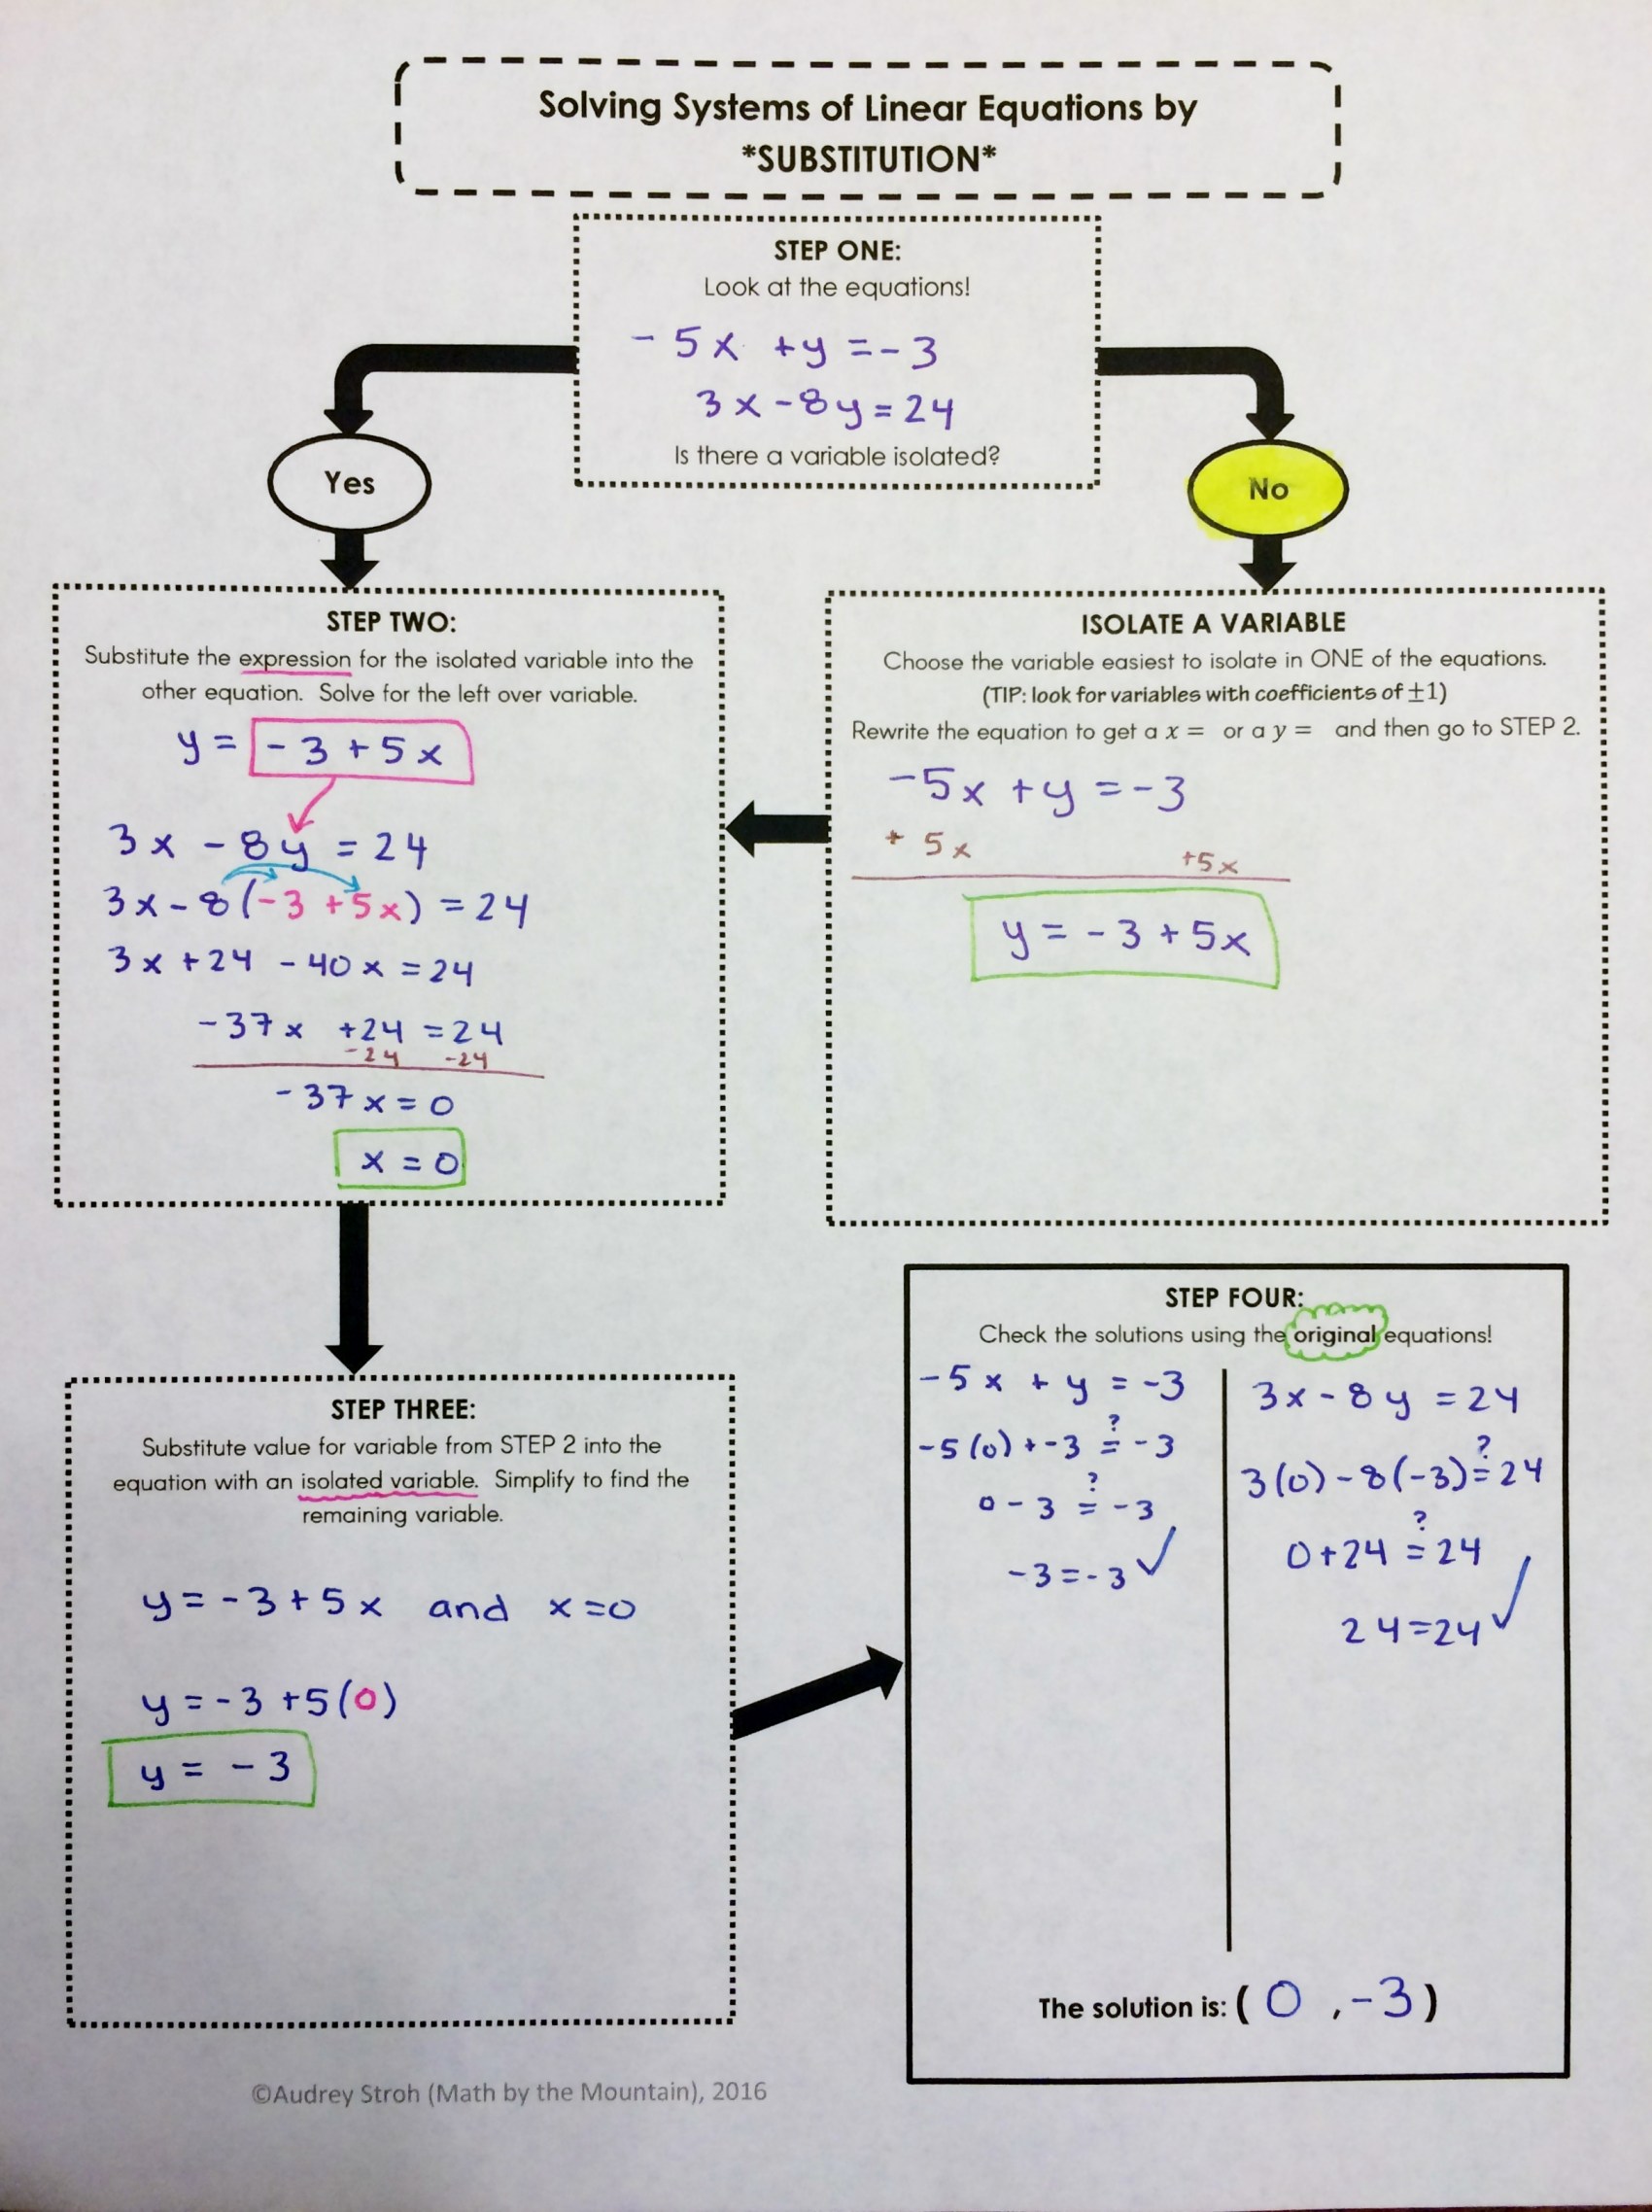
If you like the flowcharts, you can find them at my TPT store!  Today, they are 19% off when you couple your purchase with the 10% discount code OneDay.

Solving Systems of Linear Equations Flowchart BUNDLE 

Solving Multi-Step Equations Flowchart

Thank you so much for reading!


Inequality vs. Interval Notation Poster {FREE Download} #MTBoSBlaugust #Made4Math

My school doesn’t cover interval notation in its curriculum.  We focus primarily on inequality notation, although I tend to use the more specific set-builder notation.  Each representation has its merits, so I wanted to include interval notation more this year, as an occasional aside.  I’ve made a poster (8.5×14) that I’m going to hang up in my room to help students see the connections between the inequality symbols, the choice of open/closed points on a number-line, and the choice of soft/hard brackets in the interval notation. I’ve also made a color-coded version where students can ask themselves, “Can I include this point?” Green=”yes, include”, and red=”no, exclude.” Half of my classes this year are geared toward students who had received <40% in their last math class, so I’m hoping that the stop-light colors can make this yes/no, include/exclude concept easier to grasp. [NOTE: Thanks to lovely conversations on Twitter, it’s been noted that the green/red combination could potentially be dangerous if you have any colorblind students! I’m working on another, more color-friendly version that you can use, as well. I will update this post when it’s been made!]

Inequality vs interval notation poster COLOR-page-001Inequality vs interval notation poster-page-001

Before I hang the laminated poster up (I add posters throughout the year as topics arise), I’m going to print another one and cut up the grid into the 36 individual rectangles and hand one piece to each student in my class (if there are fewer students, ask your class “who wants another piece?”–I always seem to have a bunch of volunteers because this means they’ll get to talk to more people!).  Students will then find the two other classmates who have representations equivalent to their own card. Once a triple has been found, students will check their cards with the teacher.  If they are correct, they will move around the class helping the remaining students.  If they are incorrect, they will review which card(s) in their triple didn’t belong as a group of three, and then go back to finding the equivalent representations.

Would you like a copy of the reference poster? Get the color and the black and white versions here! (It’s free!)

Picture1

Special Right Triangles Display {FREE Download} #MTBoSBlaugust #Made4Math

A while back I made a display for special right triangles, and realized I never shared the files! You can download the PDF and the editable Publisher files here!  You’ll need to download the free font HVD Comic Serif Pro if you choose to edit the Publisher file yourself.

Here’s a picture of the pre-laminated pieces.  I took a few pieces of the finished product on my walls in the classroom, but each one had a nasty glare from the laminated finish.

FullSizeRender (14)


Performance/Mastery Task Checklist Poster #MTBoSBlaugust

In my state there are a couple of ways to meet the graduation requirement for math.  First of all, students need three credits of math. From there, they can either pass the SBAC test, have a high enough PSAT score, OR they can graduate by completing passing Work Samples.

Work Samples are given twice each year, and one thing that I’ve found is that math is not what typically keeps students from passing them.  It’s that they forgot to clearly communicate their plan, or forgot to state their answer as a complete sentence, or they didn’t reflect on their answer at the end.  There’s so many little places to go wrong along the way.

problem solving steps poster

To help them get used to the process, I decided that this year I would start doing one mastery task each unit as a partner quiz-grade, probably toward the end of the unit as an in-class review activity.  I made a poster to put up on the wall for students to reference whenever they are doing these mastery task quizzes.  I’m hoping that by doing this with a partner, more valuable conversation will happen to help deepen a student’s understanding of the topic.  Additionally, as students start getting used to this process, the work sample will become much less daunting.  Instead of having a 40-box rubric to follow along (that’s what the state provides, yikes!), they will have this process ingrained in them, which encompasses the requirements of a passing or exceeding score.

Lastly, I know I have had to give several proposals about how to solve a problem while I was working in a research lab in college, and this is typically the format that my presentations would follow.  If I were to give a presentation trying to sell someone that my way was the best way, this is the sequence I would follow and I believe it would suit many professions, not just the inherently mathematical ones.  I want students to get into the habit that good work needs to be backed up, and, regardless of what they are doing, good writing will need to go along with it.


Reference Angles Poster {FREE Download} #MTBoSBlaugust #Made4Math

The last few weeks of this summer have been filled with poster-making to spruce up my classroom and to make the walls more of a resource to my students.  To determine what would be the most useful posters to make, I’ve been doing a lot of reflection about last year.  One topic that I wish I had a public record/anchor chart style poster for was reference angles, which is covered in our Trigonometry unit in Algebra 2. I’ve been contemplating a lot about how I’d want it to look and had considered making an entire unit circle poster, but decided against it since I felt as if that promoted students to memorize all of the values.

I really want to get my students to the idea that they can derive as much or as little of the values as they desire.  If they want, they can derive them all from scratch, and we discuss how to do this in class.  We then talk about how if they feel more comfortable with memorizing them all so they can work quicker on a test/quiz, then they are free to do so as well.  We then have the conversation about my own personal preferences:  I memorize the sine and cosine values for the first quadrant.  From there we can easily get tangent by dividing the sine value by the cosine value, and we can think about the properties on the coordinate plane to get the appropriate signs for any other angles.  Most students choose to take my approach as well since it is a nice middle ground.

reference angles posterHere’s the PDF File – Reference Angles Poster.  I sent mine over to my school’s print shop to be printed on 24″x36″ paper. You can print it on standard 8.5×11 paper if you select “Fit” or “Shrink Oversized Pages” on your prniter’s menu.

My last project for the summer will be making labels for 0, 90, 180, and 270 degrees with their corresponding sine and cosine values to be put around the wall clock in my classroom.

Happy Sunday!  This marks 3 more weeks until I go back to school.  How much time do you have?